|
Mott-Scottky Plot.
Purpose: To determine band position of the semiconductor sample.
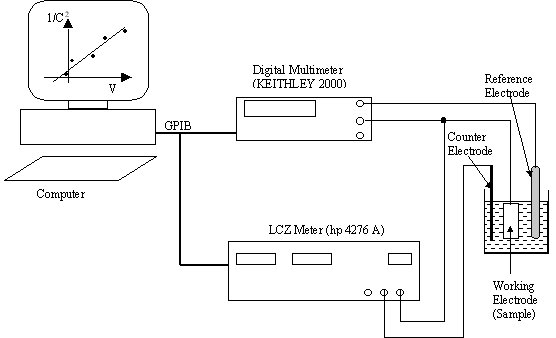
Block diagram of the Mott-Scottky plot setup.
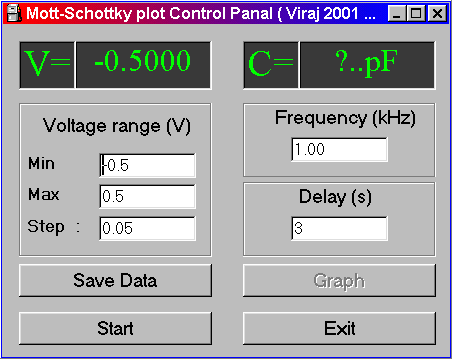
Mott-Scottky plot control pannelgraph display window
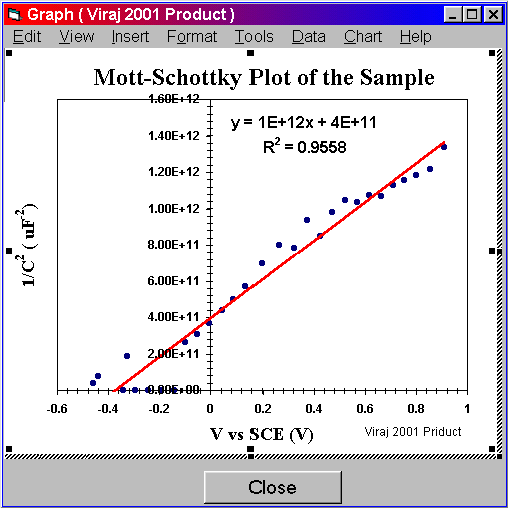
Mott-Scottky plot graph display window
Main features:
Draw the Mott-Scottky plot.
Automatically fit linear regression
line to data points.
Impedance Measurement Setup.
Purpose: To analyze the change conductivity of the semiconductor layer with
time, under the room and controlled atmospheric conditions.

Impedance measurement setup block diagram
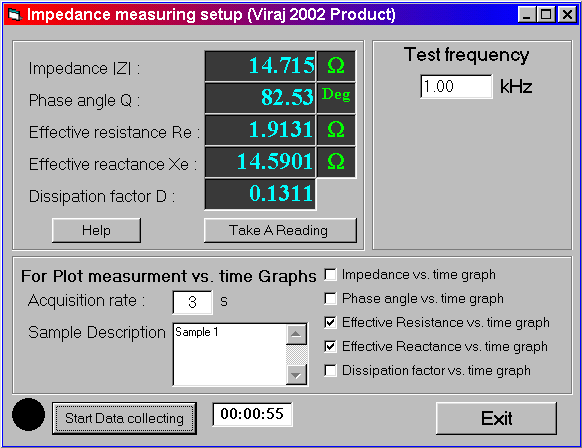
User interface parameter setting window of the software.
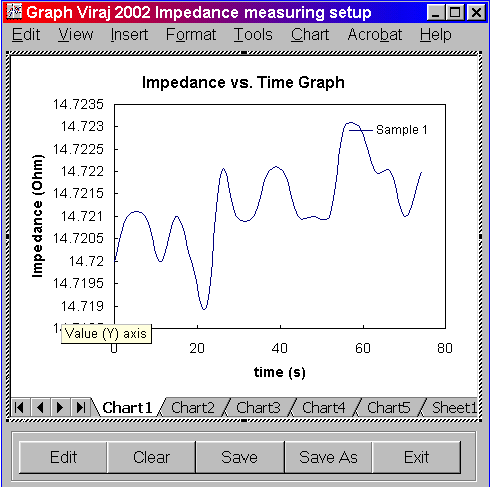
Graphs display screen
Main features:
Can be used to plot following graphs
Impedance vs. time
Phase angle vs. time
Effective resistance vs. time
Effective reactance vs. time
Dissipation factor vs. time
Can be used to plot above graphs at various test frequencies.
|