|
- Multi-Sample I-V-T Characterization Software
An in-house
software program was developed to automate the detector I-V-T (current vs.
voltage under different temperatures) characterization process. The software
controls a Keithley 2400 source meter, a Keithley 7001 switch sysytem, a SI-9620
temperature controller (for a Helium closed-cycle refrigerator) through the GPIB
interface. The system is capable of recording I-V curves of up to 10 samples in
a user defined voltage range, temperature range, and step size. In general, a
closed–cycle refrigerator is capable of working from 7 K up to 330 K in
temperature. User selectable options allow the user to save data directly in a
Microsoft Excel file or ASCII text files. As a additional feature the user can
enable current vs. time data recording at a fixed voltage, for studying
transient characteristics of the sample. The following figures show the user
interfaces and main program windows. Source codes for each form and subprograms
are listed in the next subsection.
- I-V-T setup instrument configuration

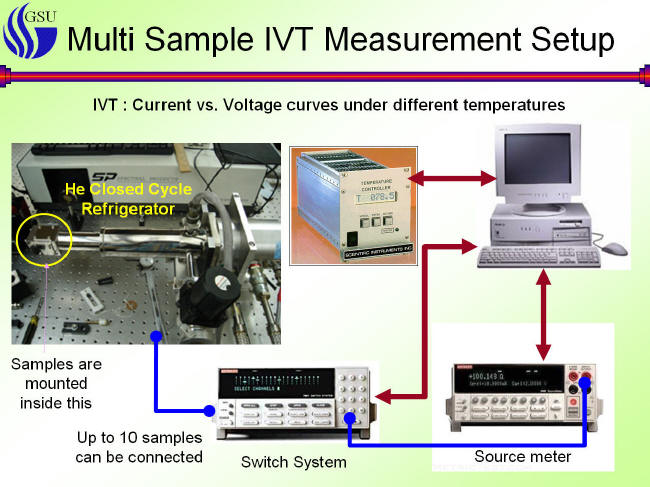
The block diagram of the I-V-T setup showing GPIB communication connections
(red lines with arrowheads) and other sample wirings (blue lines).

Photograph of the
IVT setup showing Keithley 2400 source meter, 7001 switch system, SI-9620
Temperature controller (top) and He closed cycle refrigerator (bottom).
- User interfaces of the I-V-T software

The initializing
window searches communication status of all three instruments in order to
initialize GPIB communication. If a communication error occurs or instrument is
not physically connected, it will inform the user to check the particular
instrument and connections.

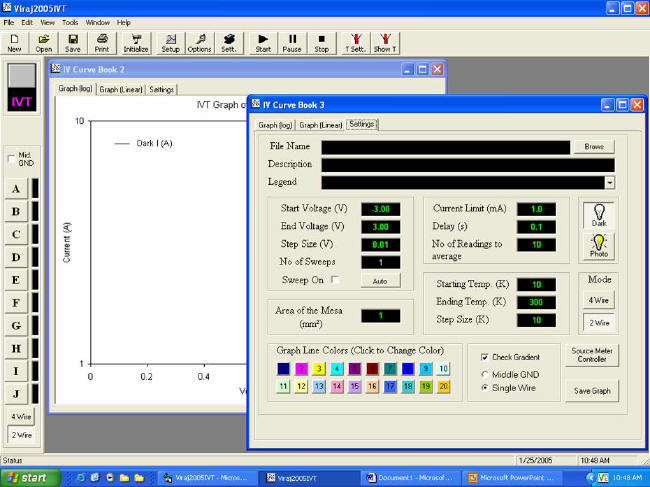
The main program
window showing manual I-V mode operation settings. In this mode user can select
the samples by clicking the buttons labeled A to J and enter scan parameters and
a temperature. The “Settings” tab and “Graph (log)” tab views are shown in the
figure.

The user
interface for the I-V mode settings. By clicking different tabs in the top of
the window the user can view different graphs such as the I-V plot on log scale,
I V plots on a linear scale, or an I-t plot for each voltage.

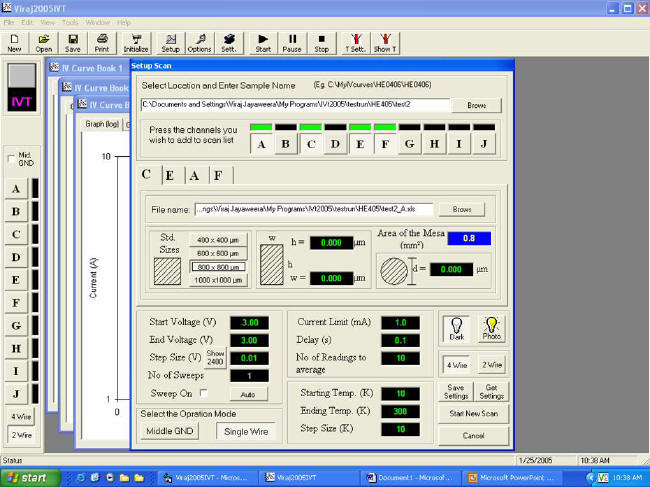
User interface
for the multi sample I-V-T scan setup. In this mode user can select the samples
to be tested (labeled as A-J), voltage range, temperature range… etc. When a
scan is started, the program will set the starting temperature. After it reaches
the specified temperature, it will switch samples one at a time and record I-V
curves. This process is repeated at each specified temperature.

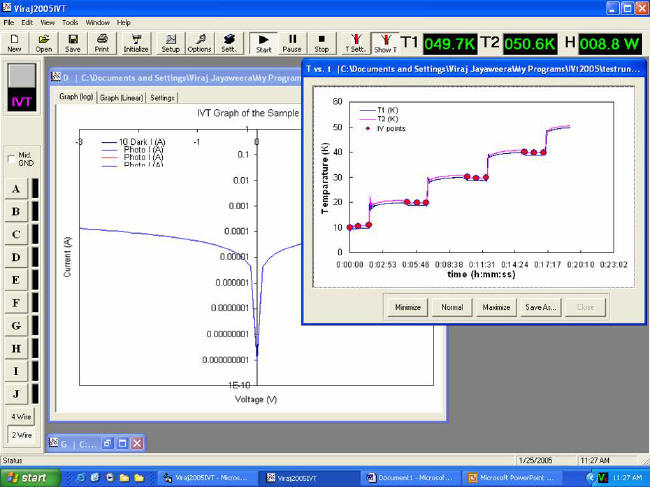
The I-V-T mode main
screen showing the active sample graph in the left window and the sample
temperature variation with the time in the right window.

The temperature vs. time plot for the I-V-T mode. Red circles
indicate the measurement starting point.

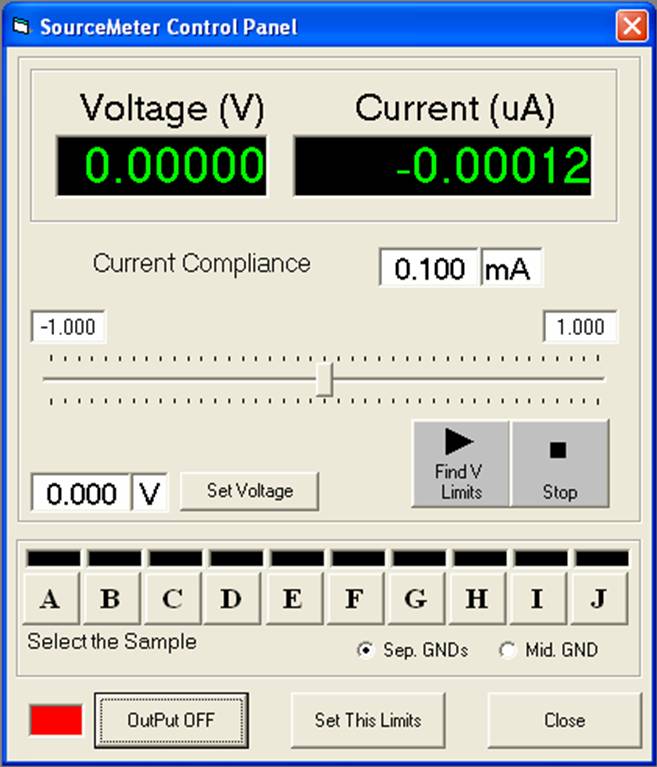
The control panel
for the Keithley 2400 source meter. The user can use this to find scanning
voltage limits based on a specified current level for their samples.

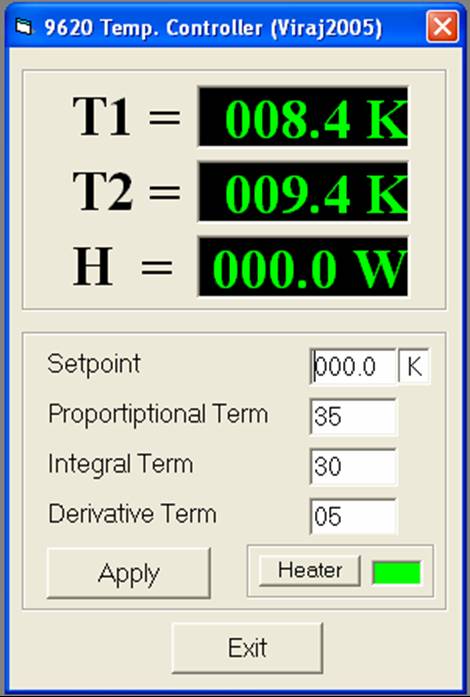
The control panel
for the SI9620 temperature controller. This can be used to observe live
temperatures close to the sample (T2), close to the heating element (T1) and the
actual heater power (H). The user also can set the temperature to a specific
value by entering a value to “setpoint”. Three constants (proportional term,
integral term, and derivative term) can also be changed that the temperature
controller algorithm needs to determine the heater power.

This panel
controls the Keithley 7001 switch system and can be used as standalone software.
By clicking corresponding button, the user can connect the corresponding sample
(A – J) to a measuring instrument (source meter, volt meter, preamplifier...
etc.). The switch system is wired in four wire configurations to allow the user
a to use wide variety of instruments which have four inputs (two wires to apply
current and two for measuring voltage) or two inputs.
(Click on image to enlarge)
(Click on image to enlarge)
(Click on image to enlarge)

(Click on image to enlarge) |